CareBridge
MyChart Extension
Duration
3 Months
March 2026 - June 2026
Role
Researcher,
UI/UX Designer
Tools
Figma, Figjam, Balsamiq, Mirro, Canva
The Problem
Caregivers managing healthcare for loved ones often have to coordinate information across multiple people, providers, appointments, medications, and communication channels. However, existing patient portals are primarily designed around the individual patient-provider relationship.
Because caregiver access is often limited, fragmented, or all-or-nothing, caregivers frequently rely on texts, notes, phone calls, spreadsheets, and memory to keep everyone informed. This can result in lost information and confusion around what information is current, who has seen important updates, and what still needs to be done.
The Research
We used a mix of qualitative and quantitative research methods across the design process. Interviews and surveys helped us understand caregiver needs, behaviors, and pain points, while usability testing helped us evaluate the clarity and usefulness of the prototype.

Key Insights
-
Information is scattered
Caregivers rely on a mix of texts, paper notes, phone calls, memory, spreadsheets, and patient portals.
-
There is no single source of truth
Care teams may not know whether they are looking at the most recent appointment details, medication changes, or care instructions.
-
Proxy access is too rigid
Existing tools often treat access as all-or-nothing instead of allowing caregivers to share only what is appropriate.
-
Communication is constant but unreliable
Caregivers may update family members repeatedly, but still experience misunderstandings or missed information.
-
Caregivers carry high cognitive load
They are not just completing tasks; they are remembering, tracking, interpreting, and coordinating across people and systems.
In our survey, 100% of respondents reported working within a care network of at least 2 people, with 77.8% coordinating with 2–3 people and 22.2% coordinating with 4–5 people. This reinforced that caregiver tools need to support shared visibility, communication, and role-based access, not just individual patient management.
72%
were not fully confident their information was up to date
68%
reported communication breakdowns between caregivers
55.6%
of respondents managed care for multiple people
The Target User
Personas & Journey Maps
We created personas and journey maps for three caregiver types: Maria, a primary caregiver managing rotating aides; Mark, a parent coordinating care across two households; and Susan, a long-distance caregiver who needs visibility without being the primary decision-maker. These artifacts helped us identify opportunities for role-based access, shared records, clearer updates, and more reliable care coordination.
Design Iterations
Sketches

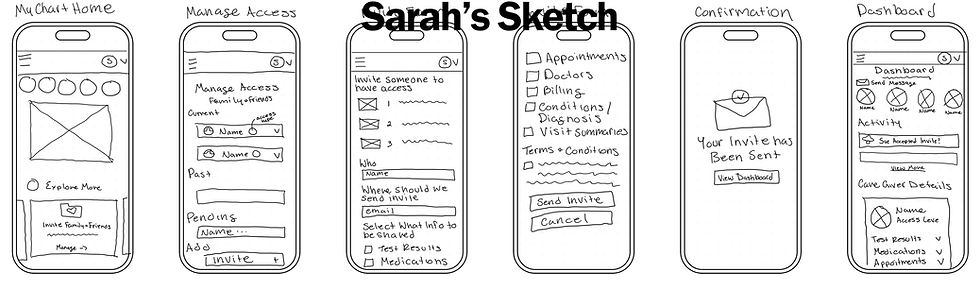

Usability Testing & Iterations
We conducted two rounds of usability testing and gained valuable, actionable feedback that helped guide our final iterations. The first round was remote and asynchronous with 4 participants, while the second included remote and in-person testing with 5 participants. Based on participant feedback, we refined the caregiver access flow by improving profile visibility, clarifying permission options, adding reusable custom roles, supporting time-limited access, and making the dashboard easier to scan through patient-specific colors, icons, and clearer section grouping.
Final Sketch

Our final sketch focused on the core experience rather than high-fidelity visual styling. We prioritized the structure, language, and interaction patterns needed to support caregiver coordination, including clearer patient context, reusable access roles, time-limited permissions, and a more scannable dashboard.
Final Design
After the group project concluded at the final sketch stage, I independently created this Figma mockup and made additional refinements to the layout and overall usability.
Figma Prototype Walkthrough
This video of the Figma prototype shows the complete user flow for adding and inviting a new caregiver.

Final Design Walkthrough
Use the arrows to see some highlights for each screen.


